20 Years of InDesign Infographic
InDesign was launched on August 31st 1999, and to mark the 20th anniversary, Adobe asked me to create an infographic. InDesign is long-established as the industry standard for desktop publishing (how antiquated that term seems these days!) and has a very strong core user following, with so many users who are incredibly passionate about it, along with many, many new users all the time, so hopefully there is something for everyone in this poster.

As usual, this piece started out with a lot of information collection and that turned out to be surprisingly difficult—many of the sites that used to keep historical data about InDesign have either disappeared completely or—more commonly—been moved on to newer platforms in recent times and the old data has not been migrated across. Teams have changed over the years as well and while you may well have the illusion of some kindly-looking, bespectacled company historian resident in the basement archive of Adobe towers, I am very confident that no such person exists.
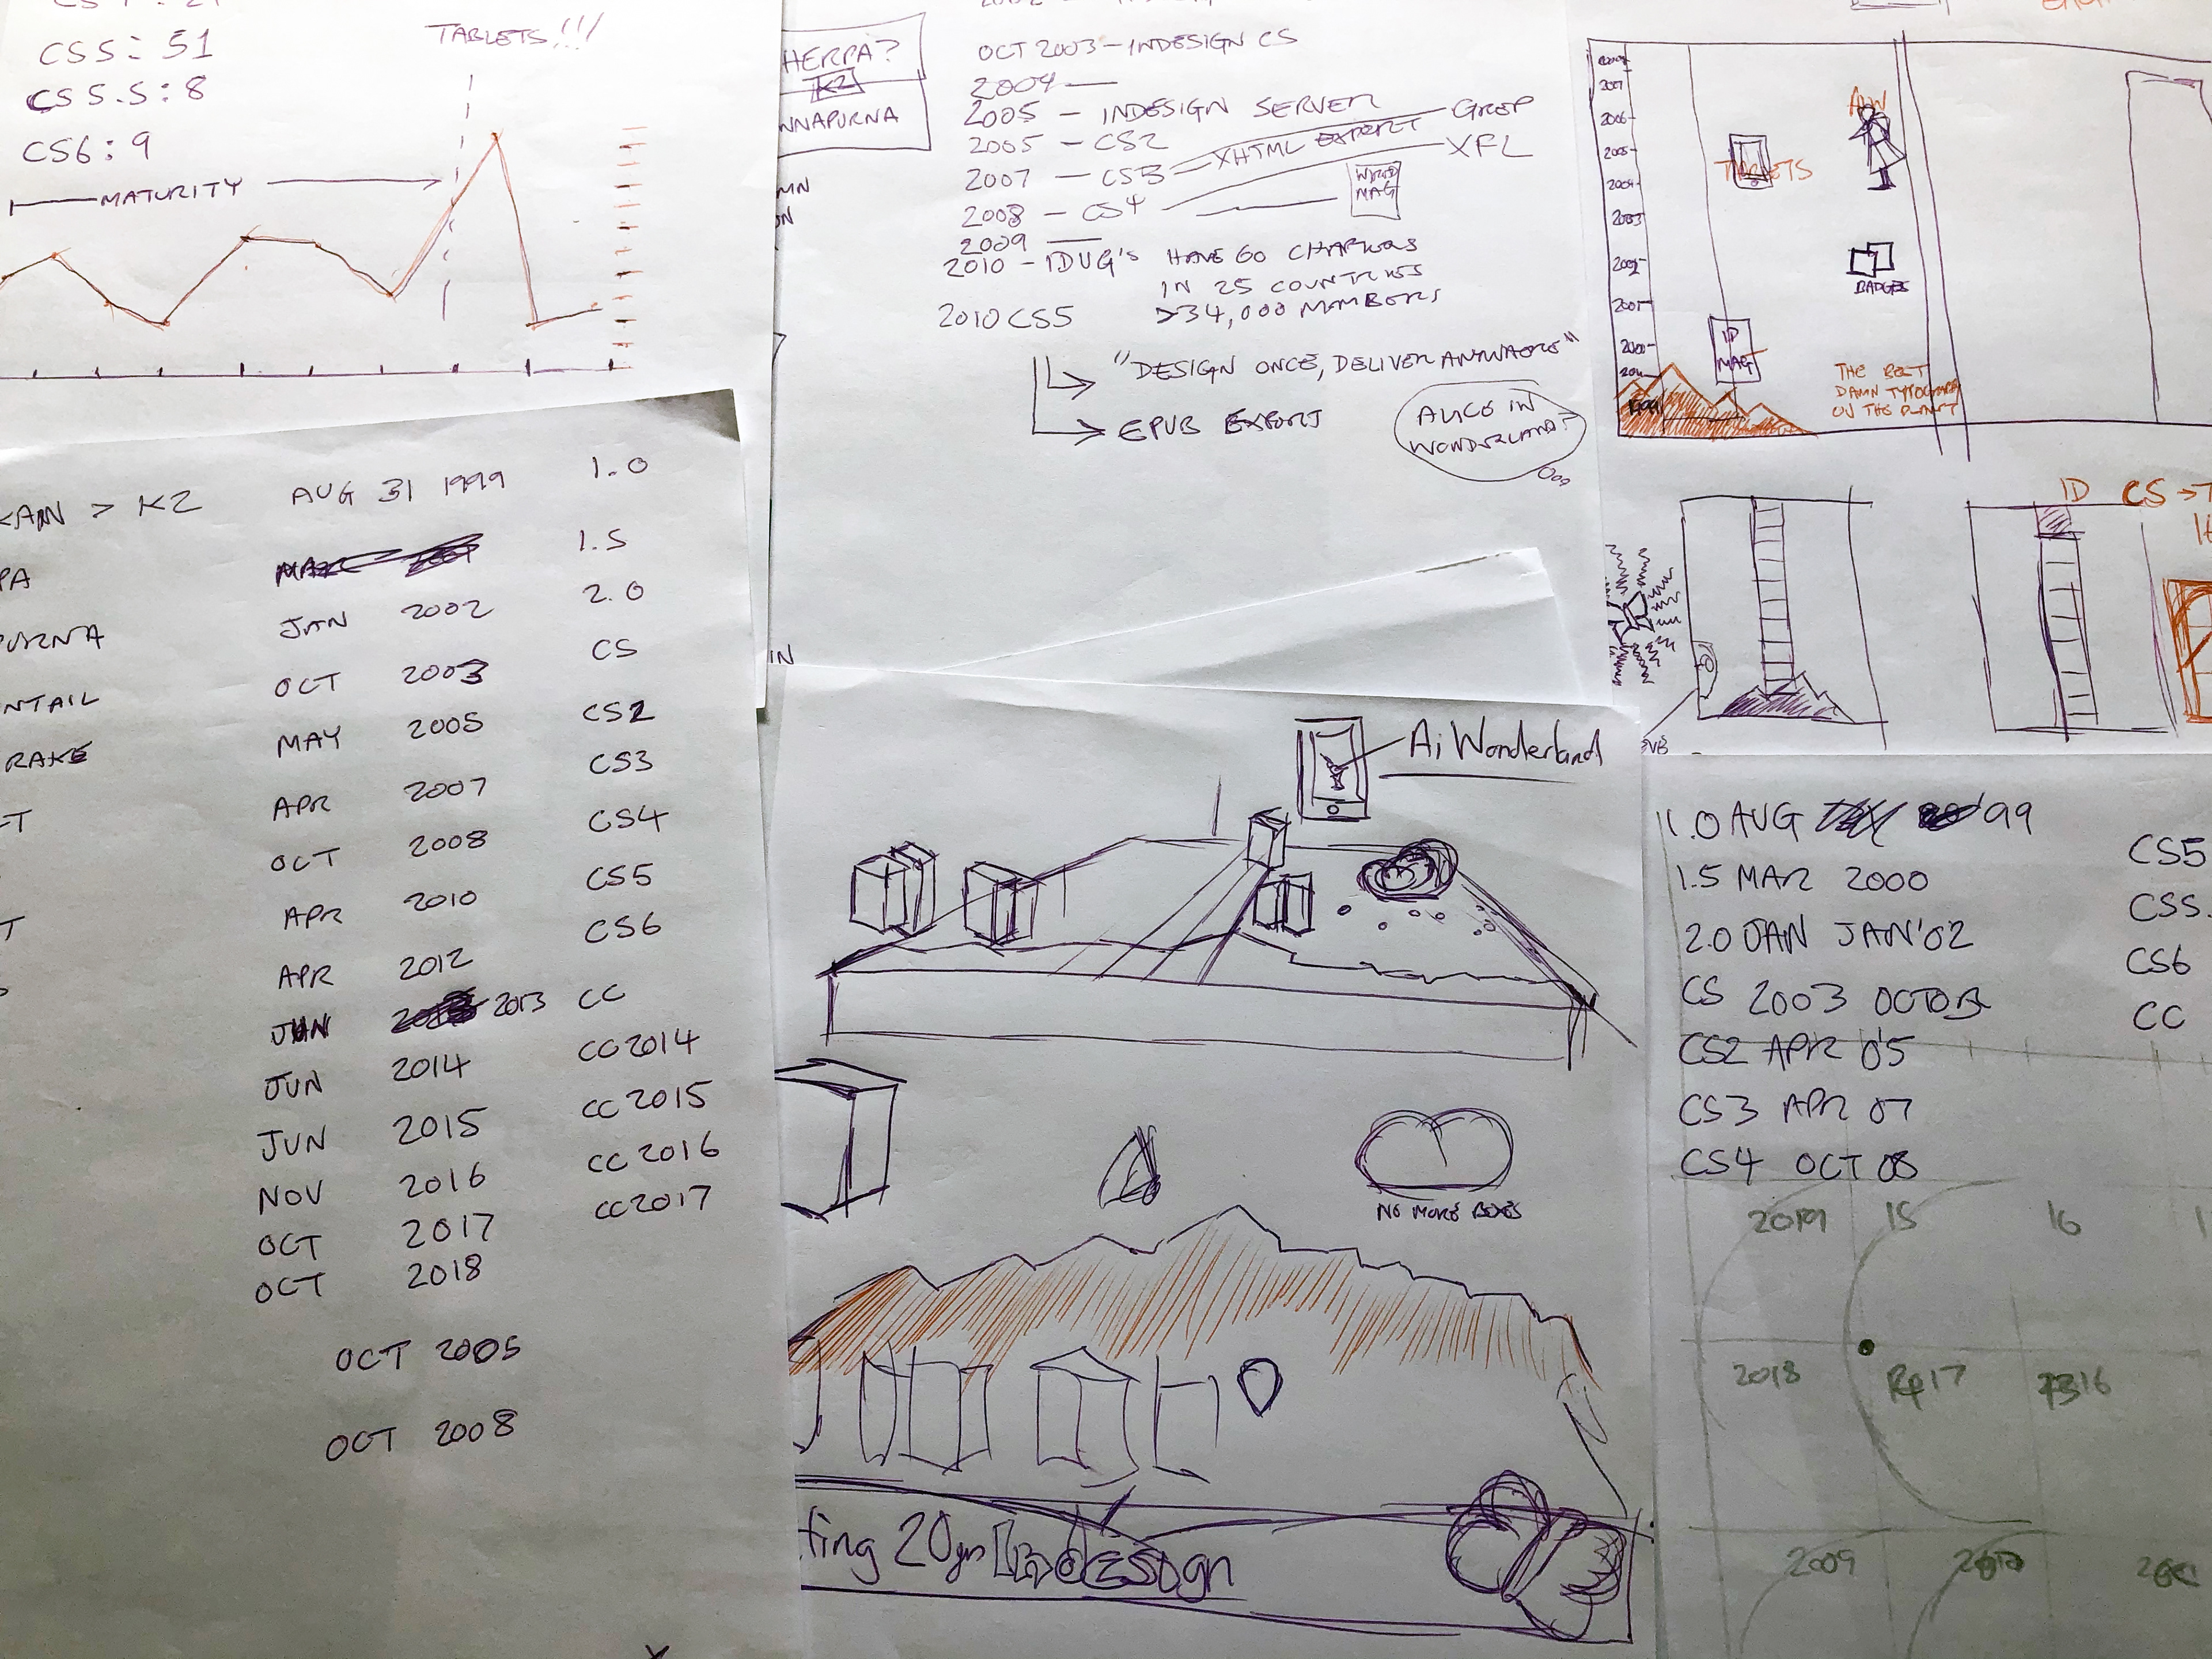
Some of the notes and thumbnail sketches that were made at the start of the project.
Fortunately, my friend James Wamser has become the guardian of a large amount of technical data for every release of InDesign, and his resource (published using InDesign Publish Online) was absolutely indispensable during this project.
David Blatner, Mike Rankin and others (listed at the bottom-right of the poster) all pitched in with handy nuggets such as the history of InDesign Splash Screens, a database of awards and reviews of InDesign and more.

After a number of different designs and iterations of the title graphic—some of which included the anniversary butterfly from the Adobe team (found at the top-right on the poster) it was a mash-up remix of the splash screens that I decided to use as a background—I'm sure that you'll be able to decode that sequence if you feel so inclined.

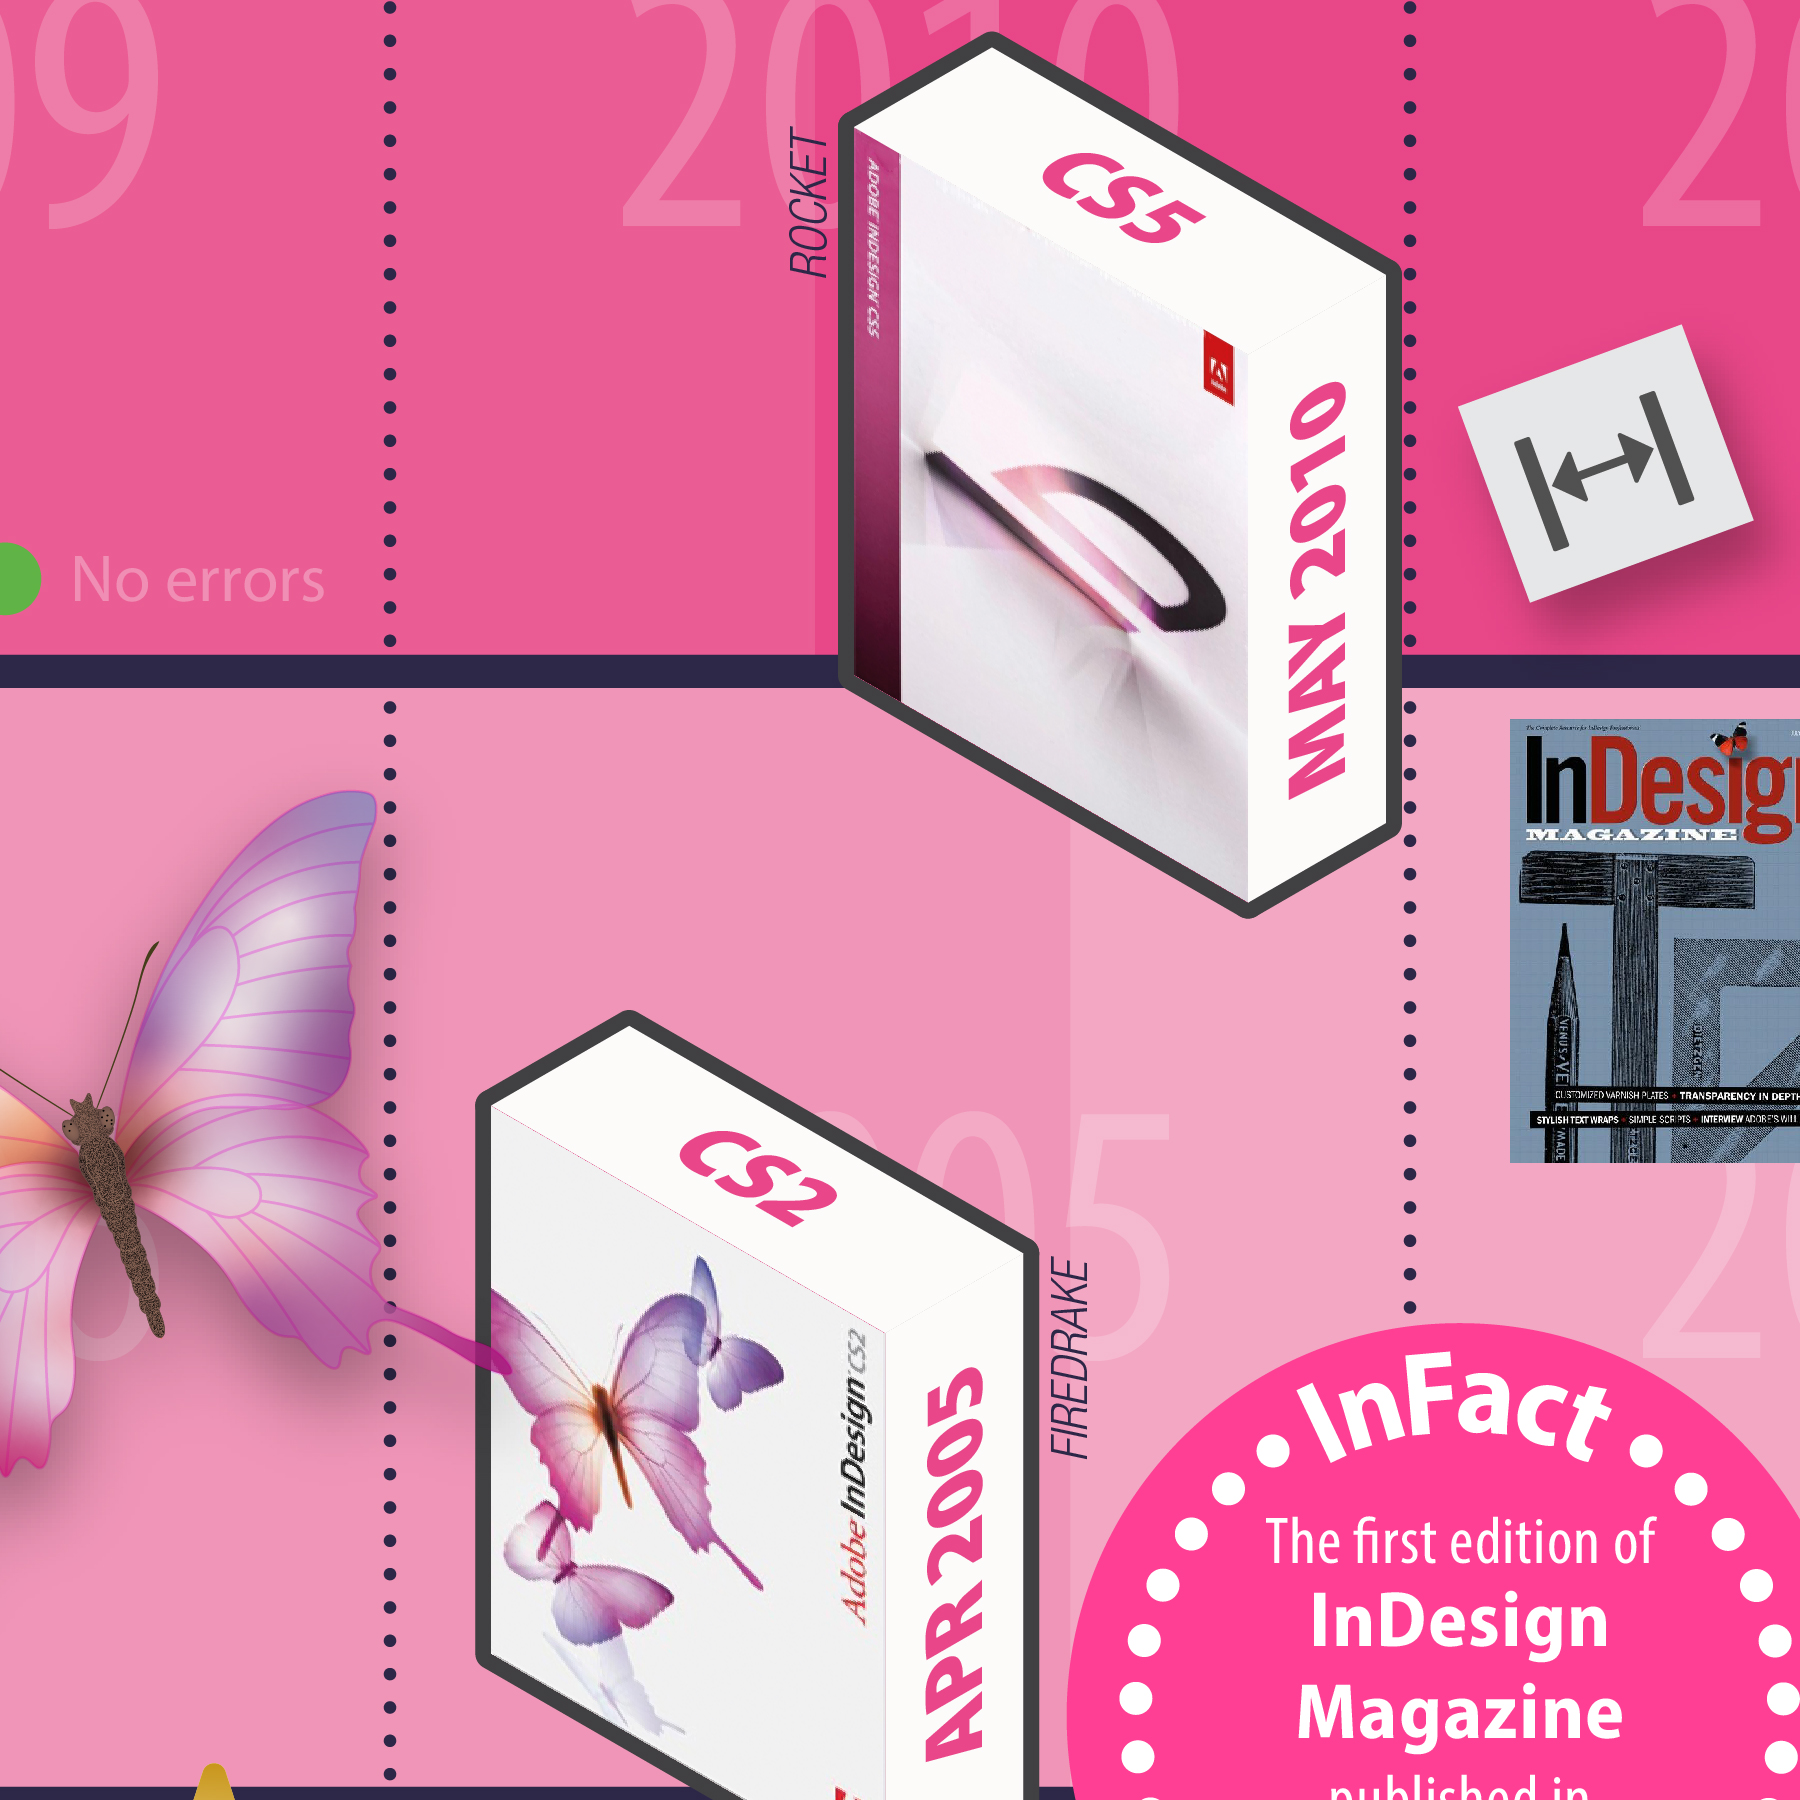
The first thing that was needed was a logical way to represent each release, and for this I determined a scheme of tints to show the "lifespan" of each version. To make this work, it was necessary to create a linear scale, and then map the releases to that; Creative Cloud increased the frequency of releases too, so you can see how important it was to be able to divide the years up into months.
Then I visualised the releases mapped to version numbers (along with their codenames—see below) and features, but decided that this would provide a skewed view of InDesign's development; while it looks like there was more development around the "teenage years" the release frequency was longer—and so those numbers don't stack up.
You can see how the tint-scheme was implemented into the final timeline version, and also see the "dot releases" in the CC versions, but only some key features associated with versions were included—but perhaps I'll challenge myself to do that for the 30th anniversary!

The eagle-eyed among you will notice some additional codenames that don't map directly to a product release; are these super-secret versions, created in a special lab at Adobe Research? While that sounds a bit fun, they are actually the codenames for InDesign Server, an enterprise-level automation solution for producing documents quickly and at scale, for a range of publishing intents.
A Note about Codenames:
Knowing the codenames of products has no bearing on how great your use of InDesign is, but do show how "into it" you are (or provide you with quiz knowledge) and it seems that the engineers no longer use them with the increased frequency of releases of CC, but again, this is a nod to the InDesign aficionados who treasure the information.
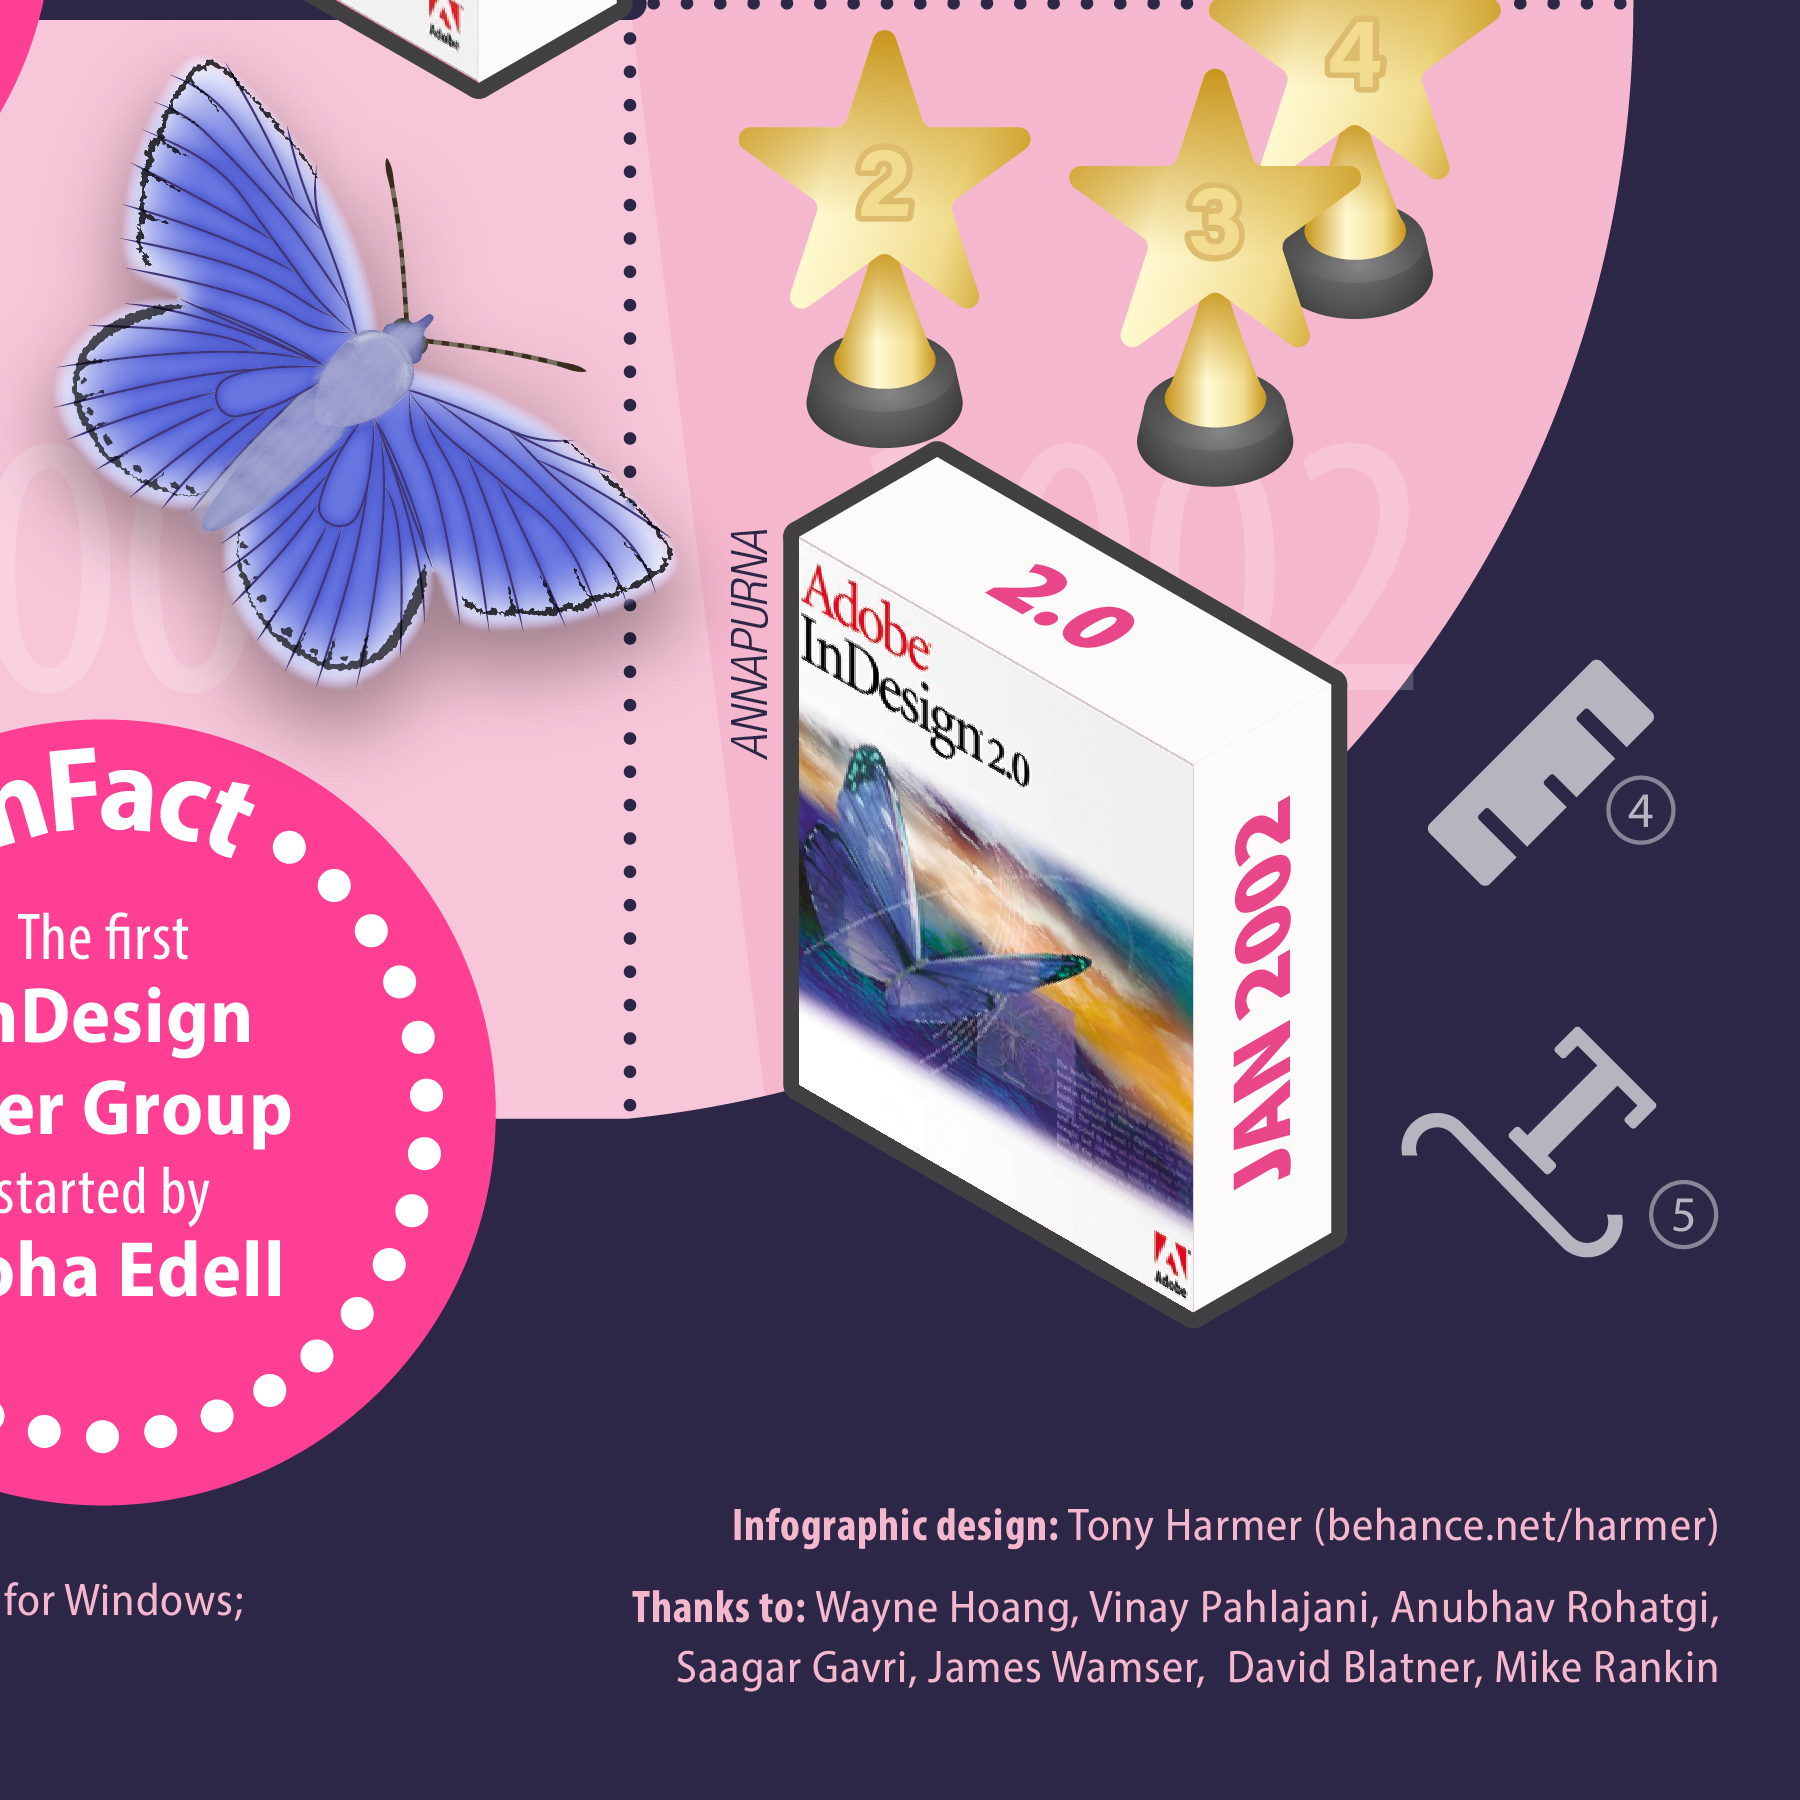

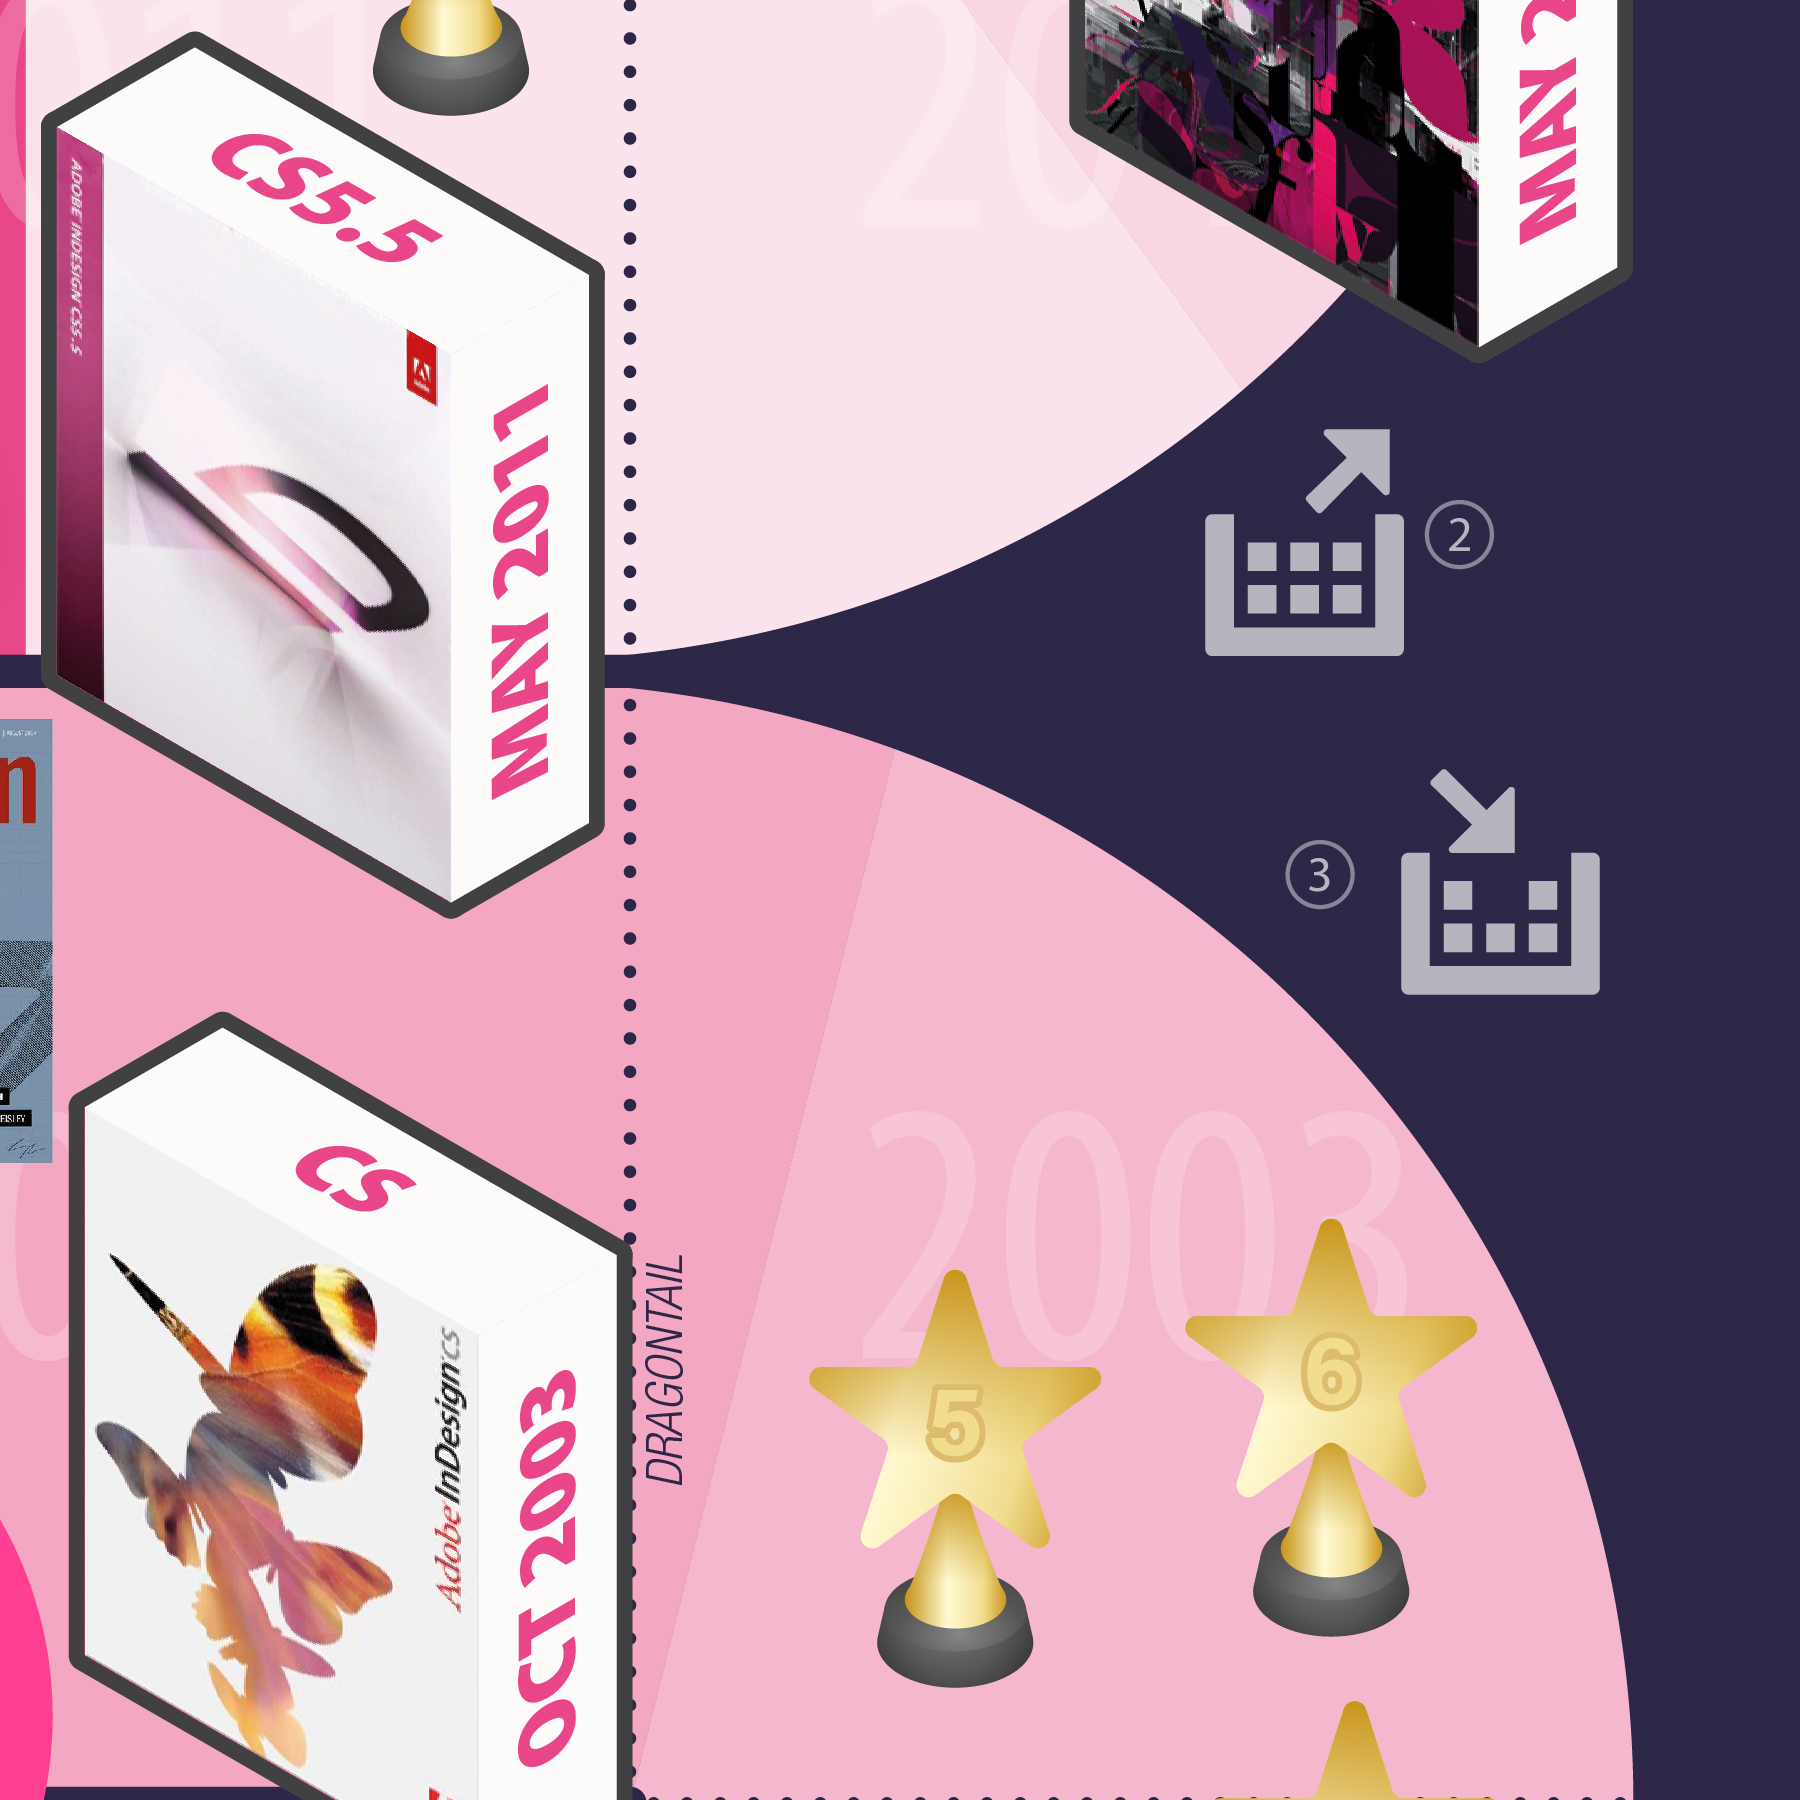
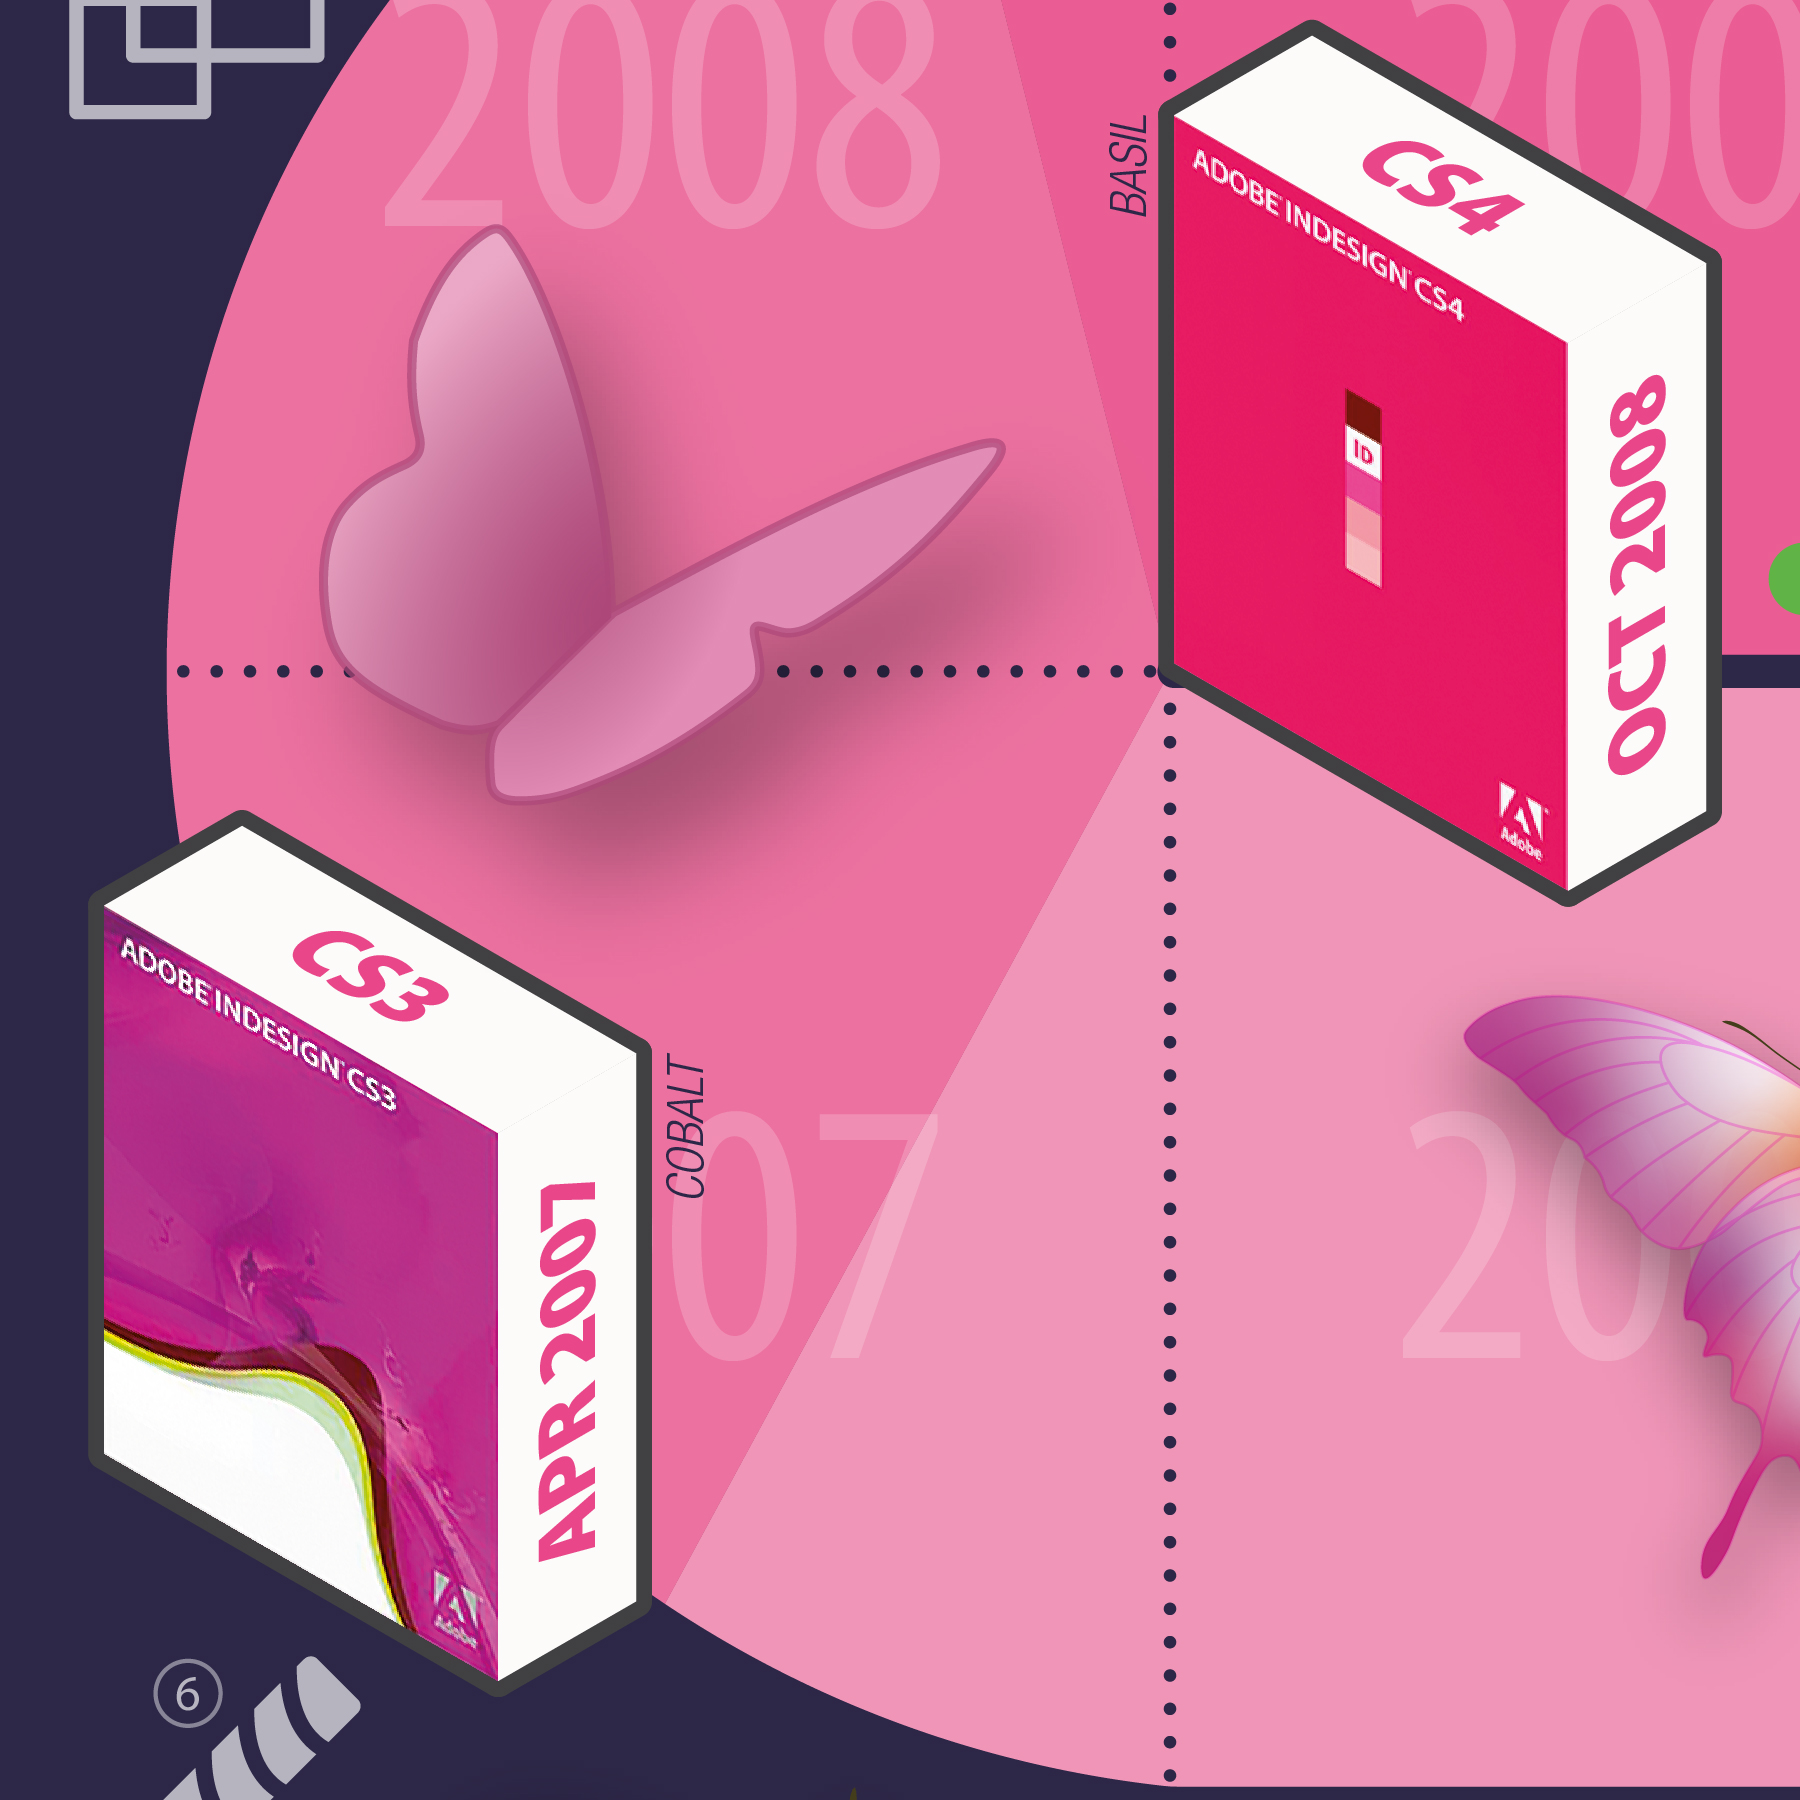
Finding related interest items and decorative elements was quite fun although there were probably about twenty-or-so variations along the way. The InDesign butterfly mascots were a given and even though they were discontinued as of CS3, there is still a butterfly in InDesign—but do you know where to find it? Give yourself 100 extra InPoints if you do.
Other elements included tool icons, and these spawned a little fringe quiz to test your knowledge of tools by selecting ten of the perhaps lesser-known icons and placing them along the periphery of the timeline. How many do you know?
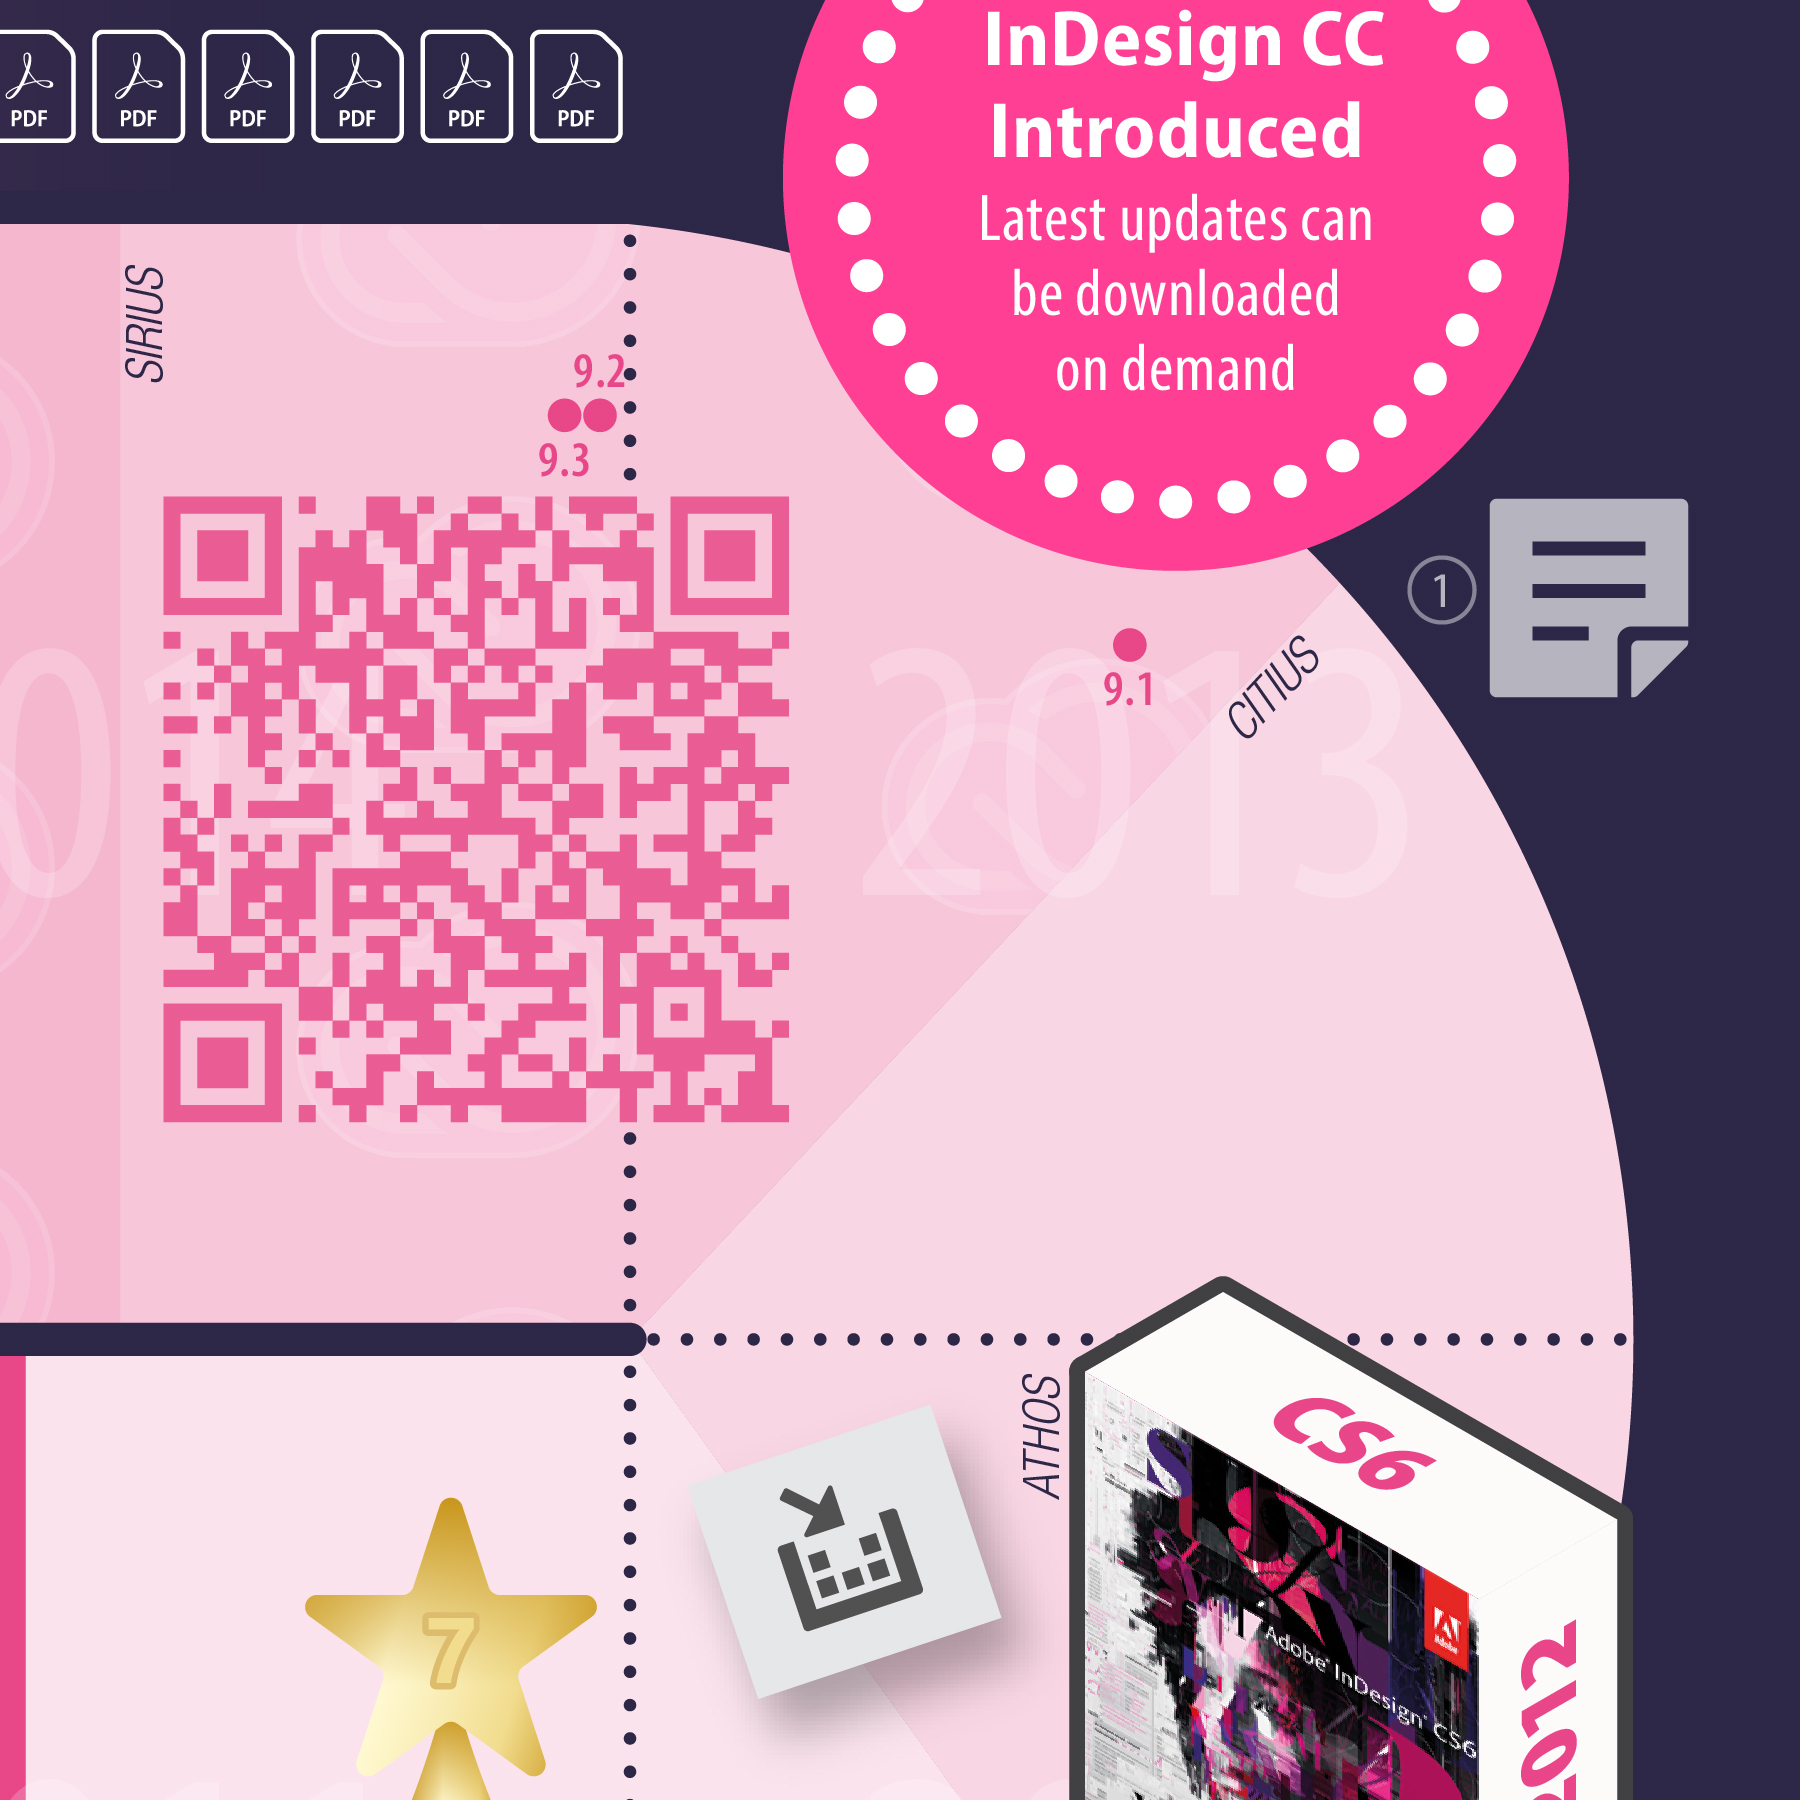
A whimsical-yet-functional inclusion was the QR code above; lots of users don't know that InDesign has a built in command/function to create QR codes and the one used here actually links to the official help page for more information on the feature.
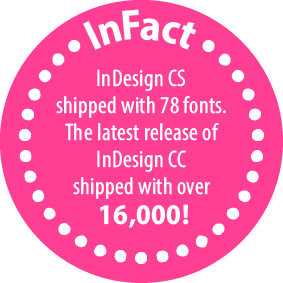
The "InFact" items were created to share more detailed nuggets of information, that relied on text. While the infographic was sent out for internationalisation, at the time of writing I haven't seen any of the translated versions—so hopefully it all fits!

The awards were another item that relied on some supporting text. Originally I set out to draw all of the awards (such as the famous "Eddy" award from Macworld) but this didn't work, so a simpler graphic with a numeric index at the foot of the poster became the solution.
There were also a number of other small challenges to overcome—as there always are with any kind of infographic—but hopefully you'll enjoy examining the poster and if you have any questions, please feel free to ask them via the comments below.